Navigating the App
Now that your account has been created let's quickly explain the general layout of the Connect IoT App.
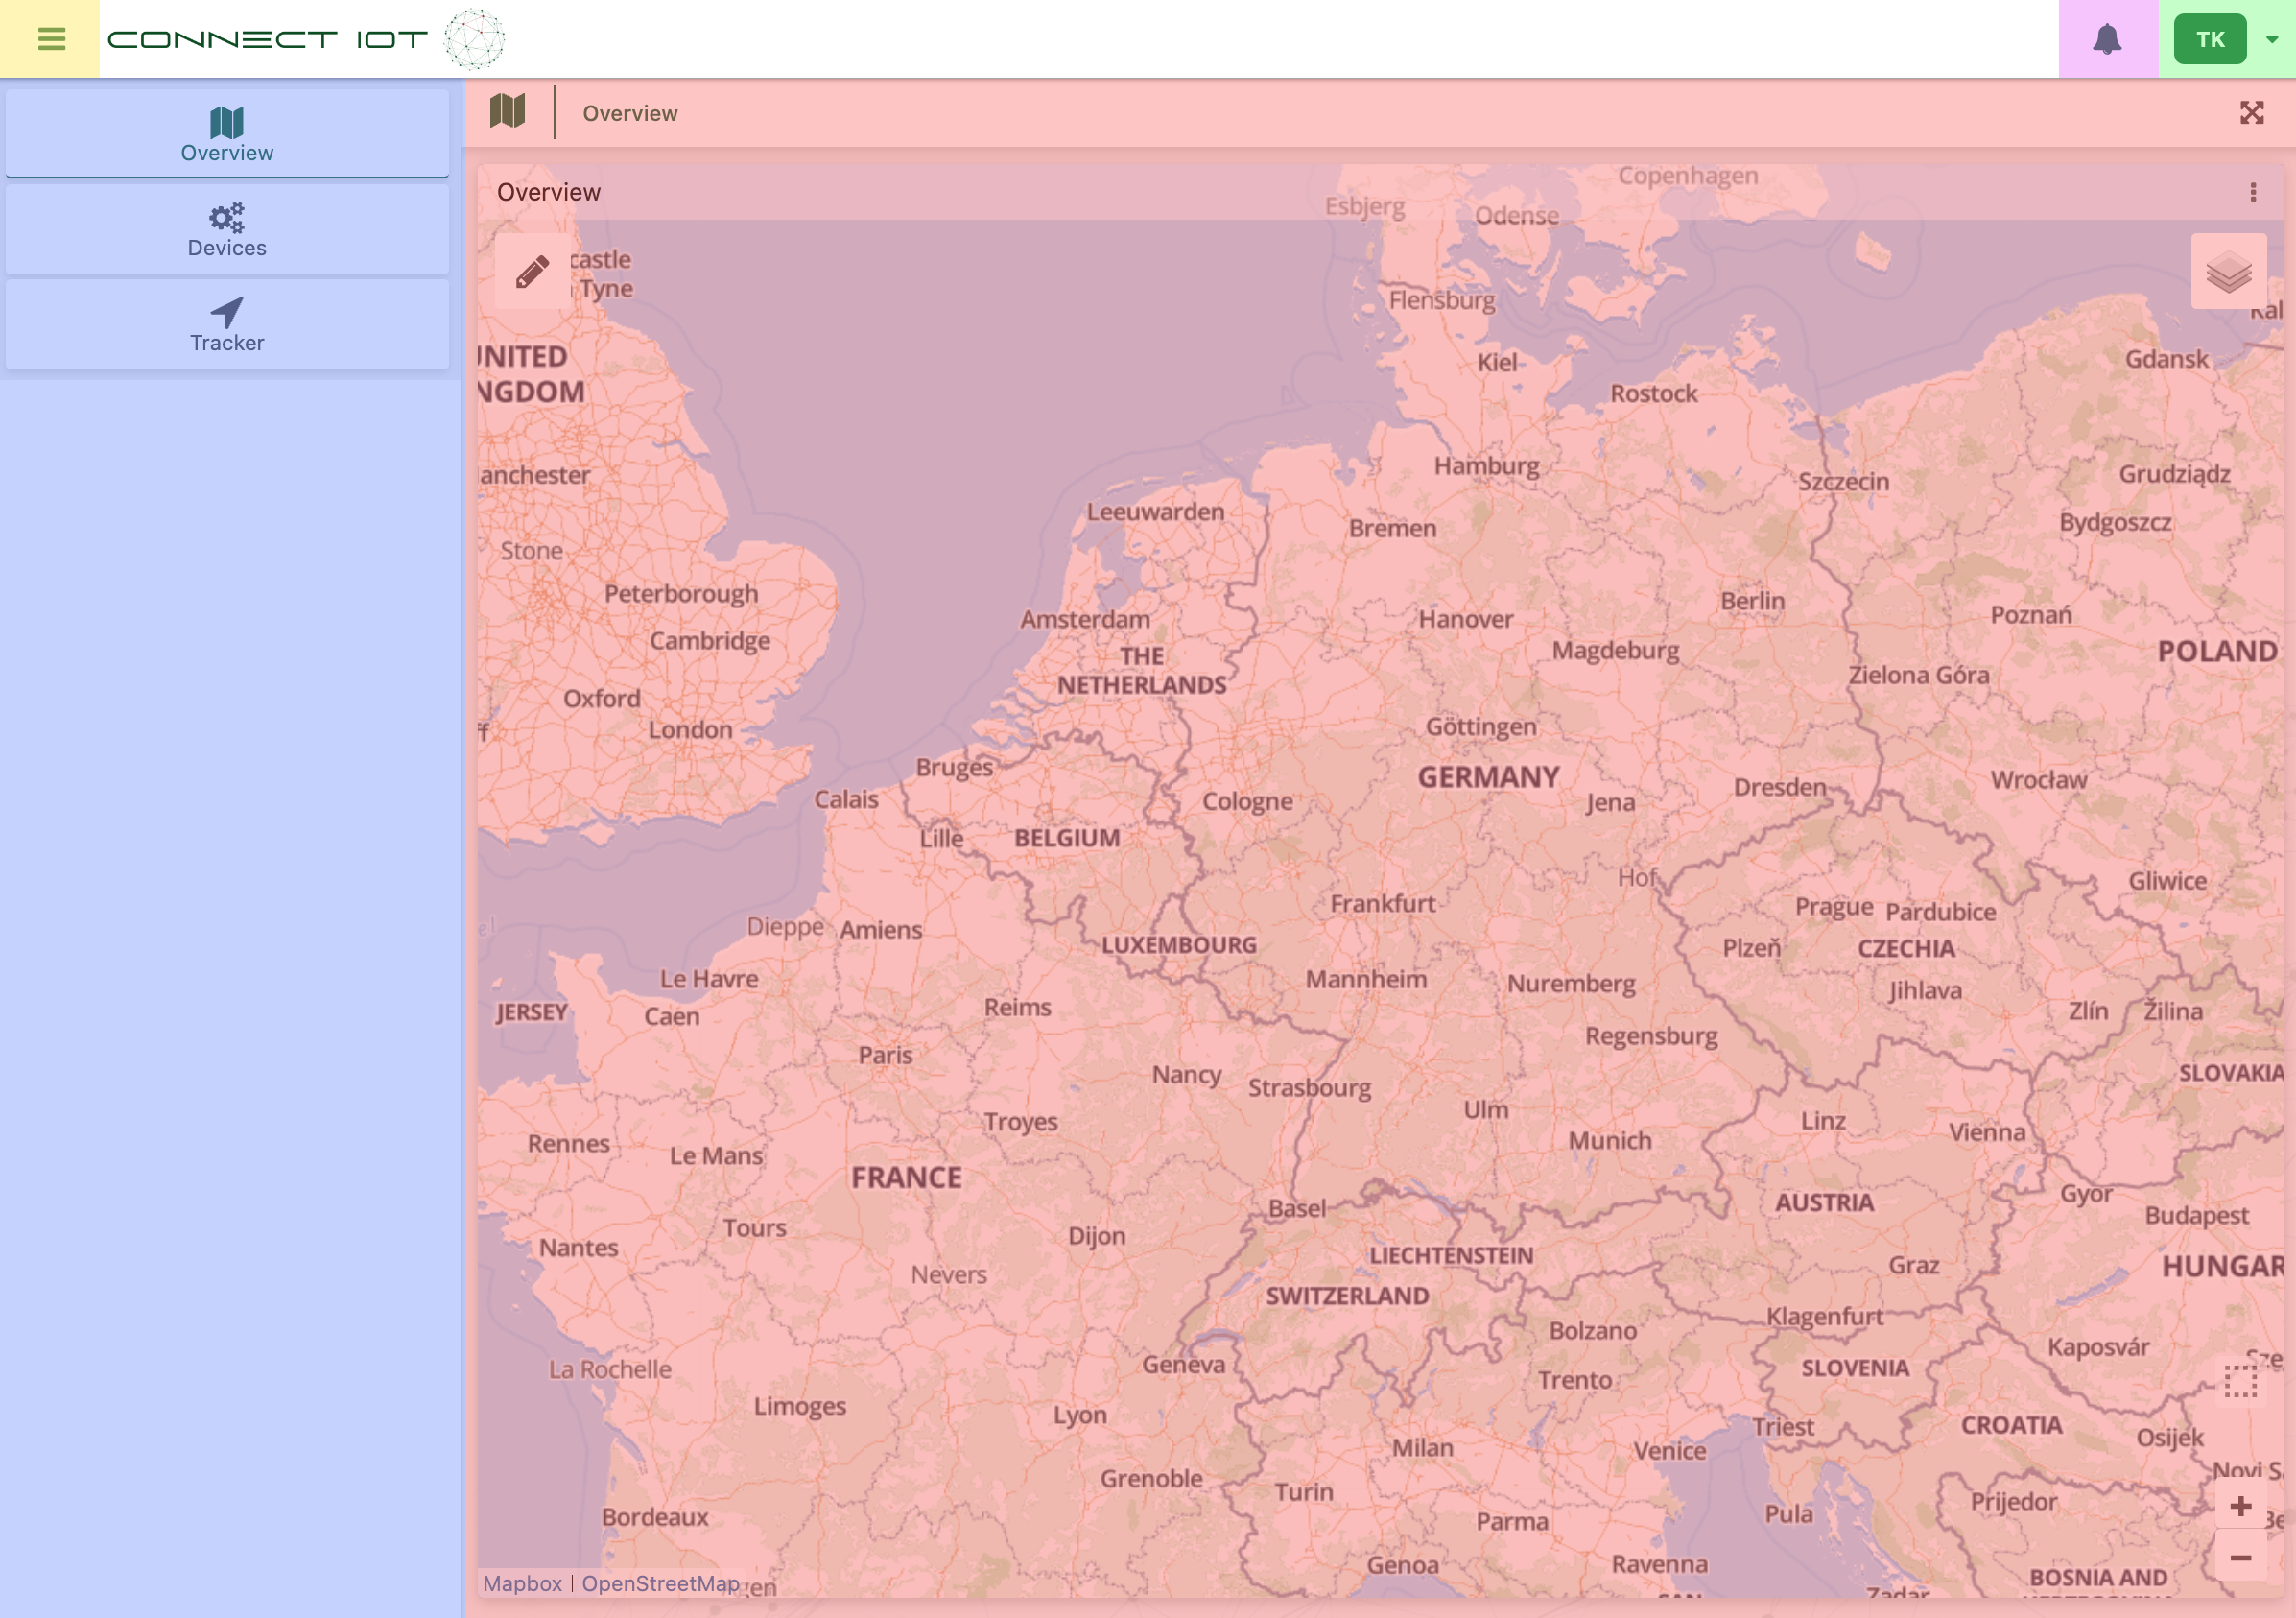
- Yellow: Open & Close the Sidebar.
- Blue: The Sidebar used to navigate between dashboards
- Red: The dashboard area. In this area the data from your devices will be displayed.
- Pink: View notifications.
- Green: Profile settings
The Sidebar
The sidebar is straight-forward but we'll give a small explanation about default dashboards and detailed dashboards.
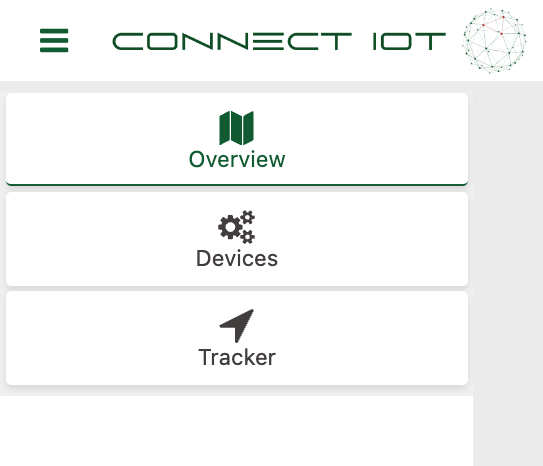
Default Dashboards
In the sidebar you will find a couple of default dashboards. Currently the default dashboards are:
- Overview (Read more)
- Devices (Read more)
- Tracker (Read more)
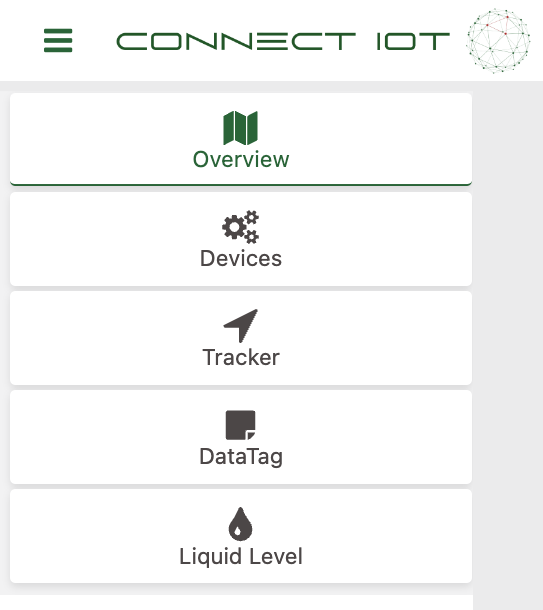
Detailed Dashboards
Detailed dashboards are dashboards that contain detailed information for specific devices. For example a Liquid Level sensor sends the measured level of the liquid left in a container and a DataTag sends its temperature. To get a more in-depth and organized look into this data these detailed dashboards are created for you and can be accesed via the sidebar:
Great! You've now succesfully signed up and know your way around the app!